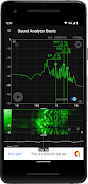
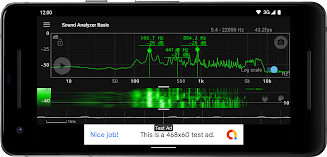
Sound Analyzer Basic is a mobile application designed for real-time analysis of audio signals. It offers a comprehensive suite of features, including the display of frequency (Hz) and amplitude (dB) spectra, as well as the visualization of spectral changes over time (waterfall view) and sound waveforms simultaneously. The app boasts high frequency measurement accuracy, with a measurement error typically within 0.1Hz in low-noise environments.
Key features of Sound Analyzer Basic include:
- Peak frequency display: Identifies and displays the dominant frequency in the audio signal.
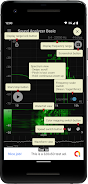
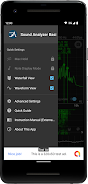
- Touch-based display range adjustment: Allows users to easily adjust the displayed frequency range for focused analysis.
- Switchable frequency axis scale: Provides the option to view the frequency axis in either logarithmic or linear scale, enabling different perspectives on the spectral data.
- Waterfall view: Displays the evolution of the frequency spectrum over time, offering insights into dynamic changes in the audio signal.
- Waveform view: Presents a visual representation of the sound waveform, complementing the spectral analysis.
- Screenshot function: Enables users to capture and save images of the displayed data for later reference.
The app supports a high frequency range setting up to 96kHz. However, it's important to note that frequencies above 22.05kHz may be filtered out in most devices, potentially leading to weak noise in that range. Additionally, certain frequencies like 48kHz and 96kHz might exhibit increased noise due to filter processing in specific device models.
Six advantages of the Sound Analyzer Basic app:
- Real-time frequency and amplitude display: Provides immediate analysis of audio signals by displaying the frequency and amplitude spectra in real-time.
- Spectral changes over time: Enables users to monitor the evolution of the audio signal by displaying changes in spectra over time.
- Waveform visualization: Offers a comprehensive view of the audio signal by displaying sound waveforms alongside spectral analysis.
- High measurement accuracy: Delivers highly accurate frequency measurements, with an error typically within -1Hz in low-noise environments.
- Customizable display range: Allows users to easily adjust the display range through touch operation, enabling focused analysis of specific frequency ranges.
- Optional frequency axis scale: Provides flexibility in viewing the spectral data by offering the choice between logarithmic and linear scales for the frequency axis.
Tags : Media & Video